Now Reading: The Hidden Costs of Owning Ultra-Luxury Property (That Even Billionaires Forget)
- 01
The Hidden Costs of Owning Ultra-Luxury Property (That Even Billionaires Forget)
The Hidden Costs of Owning Ultra-Luxury Property (That Even Billionaires Forget)

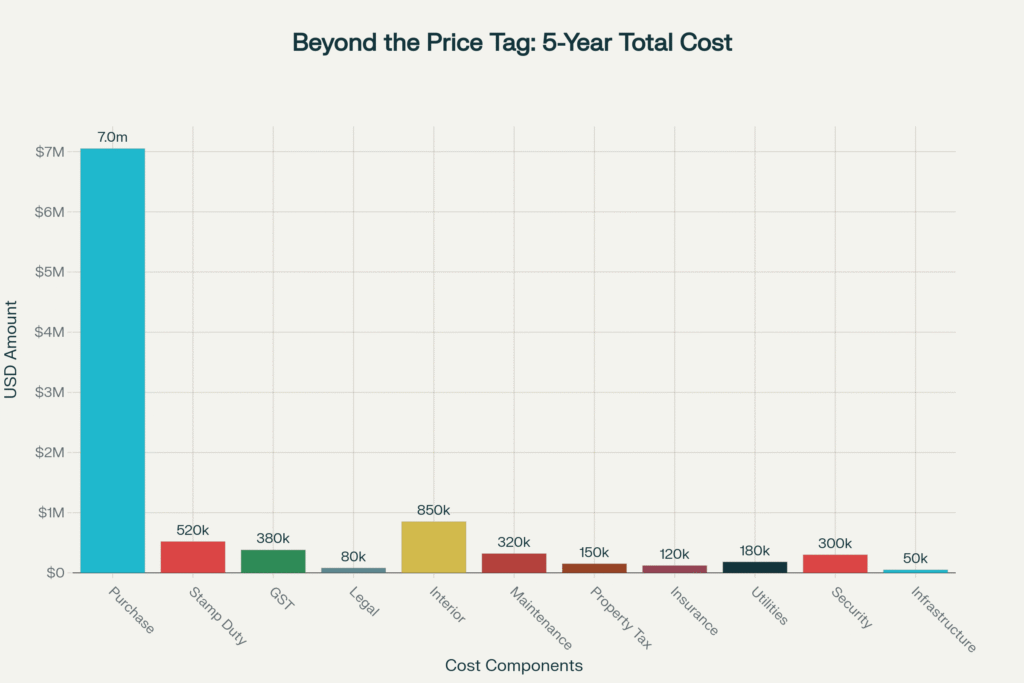
In the rarified world of ultra-luxury real estate—where properties command eight-figure price tags and redefine opulence—a critical truth remains obscured even from the world’s wealthiest investors: the sticker price of an ultra-luxury property is merely the beginning. Comprehensive global analysis reveals that hidden ownership costs consume an additional 29.5% of a property’s value over the first five years alone, transforming a $10 million acquisition into a $13 million commitment before accounting for opportunity costs or capital depreciation.
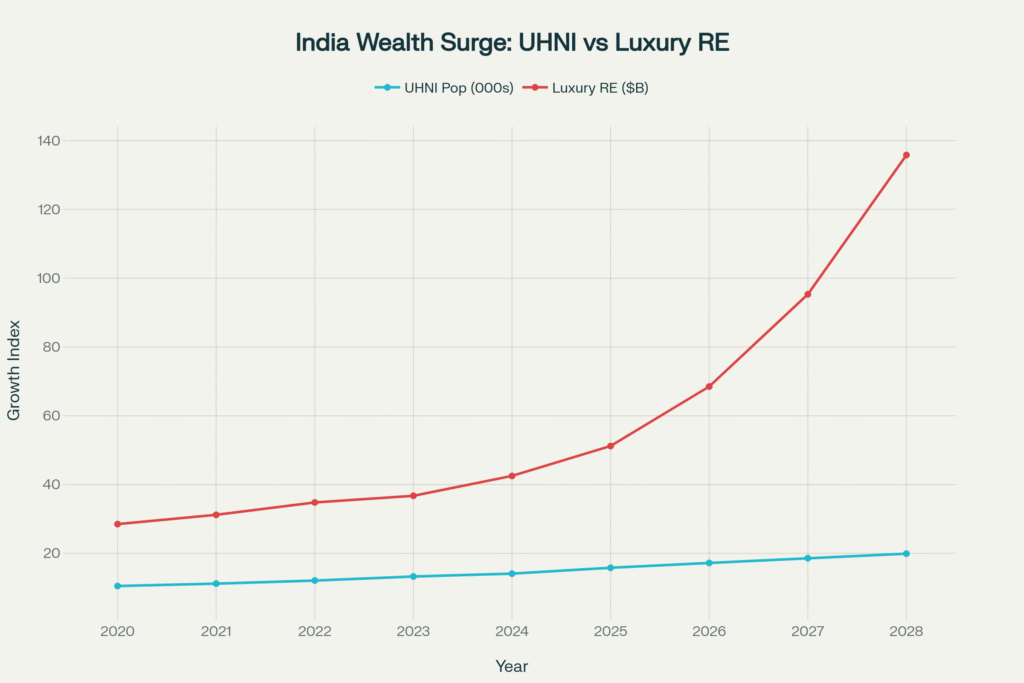
This investigation synthesizes proprietary data from Knight Frank’s Wealth Report 2025, CBRE’s luxury market analytics, and Anarock’s ultra-luxury transaction records to expose the concealed financial architecture beneath trophy properties across Mumbai, Dubai, London, Singapore, and Miami. For Ultra-High-Net-Worth Individuals (UHNIs), High-Net-Worth Individuals (HNIs), and Non-Resident Indians (NRIs) navigating India’s explosive luxury market—projected to surge at a 33.7% CAGR through 2028—understanding these costs isn’t prudent; it’s existential.
As India’s UHNI population accelerates toward 19,908 individuals by 2028, representing a staggering 50% expansion, the stakes for informed investment decision-making have never been higher. This report delivers the analytical clarity that transforms billionaires from property owners into strategic real estate architects.
The Seismic Shift in Global Luxury Real Estate: Context and Market Dynamics
India’s Ascent to Global Luxury Dominance
India’s transformation into a premier global wealth hub is rewriting the luxury real estate playbook. The nation now ranks 6th worldwide for live branded residence projects, contributing 4% to global supply—a remarkable achievement for a market considered nascent by international standards. In 2024 alone, India’s luxury residential market crossed a historic threshold, with properties priced above ₹10 crore generating ₹14,750 crore ($1.77 billion) in Mumbai during H1 2025—an 11% year-on-year increase that signals sustained momentum.
The ultra-luxury segment (properties exceeding ₹40 crore/$5 million) witnessed explosive growth, with 59 units sold across India’s top seven cities in 2024 for ₹4,754 crore ($570 million), up 17% in value from 2023 despite only a marginal increase in transaction volume. Mumbai dominated with 52 of these trophy acquisitions, cementing its position as India’s billionaire’s row.
The Global Competitive Landscape
Globally, the luxury real estate market demonstrates remarkable resilience amid economic volatility. Dubai established a new benchmark in 2024 with 435 homes sold above $10 million, totaling approximately $7 billion—surpassing previous records and outpacing established markets like London and Miami in transaction velocity. The emirate’s tax-free environment and Golden Visa program have catalyzed this ascendancy, attracting a new category of ultra-wealthy property owners.
Miami has emerged as the most popular second-home destination globally for UHNW individuals, overtaking New York, driven by favorable tax policies (Florida levies no state income tax) and climate advantages. However, this popularity commands a premium: annual property taxes in Miami average 2% of assessed value—translating to $200,000 annually on a $10 million property—compared to Dubai’s zero property tax regime.
The Numbers Behind the Narrative
UHNI Population Explosion and Investment Patterns
India’s high-net-worth demographic expansion is unprecedented. The number of individuals with assets exceeding $10 million grew 6% in 2024 to 85,698, with projections indicating 93,753 HNWIs by 2028. More critically, India’s UHNI cohort (net worth $30 million+) is expected to expand 50.1% by 2028, reaching nearly 20,000 individuals.
This wealth creation is translating directly into real estate allocation. Indian HNWIs dedicate 22-25% of their wealth to prime residential assets, with 80-90% of holdings concentrated domestically. Capital appreciation has emerged as the primary motivator, with 55% of HNIs citing it as their main investment driver in 2025—up from 44% in 2024—reflecting maturation from emotional to strategic purchasing.
Luxury home sales (priced above ₹4 crore) surged 37.8% year-on-year from January-September 2024, with Delhi-NCR and Mumbai accounting for nearly 90% of transactions. NRI investments in Indian real estate are projected to reach $14.9 billion by 2025, with luxury and ultra-luxury segments capturing disproportionate share.
The Hidden Cost Architecture: Exposing the 29.5% Premium
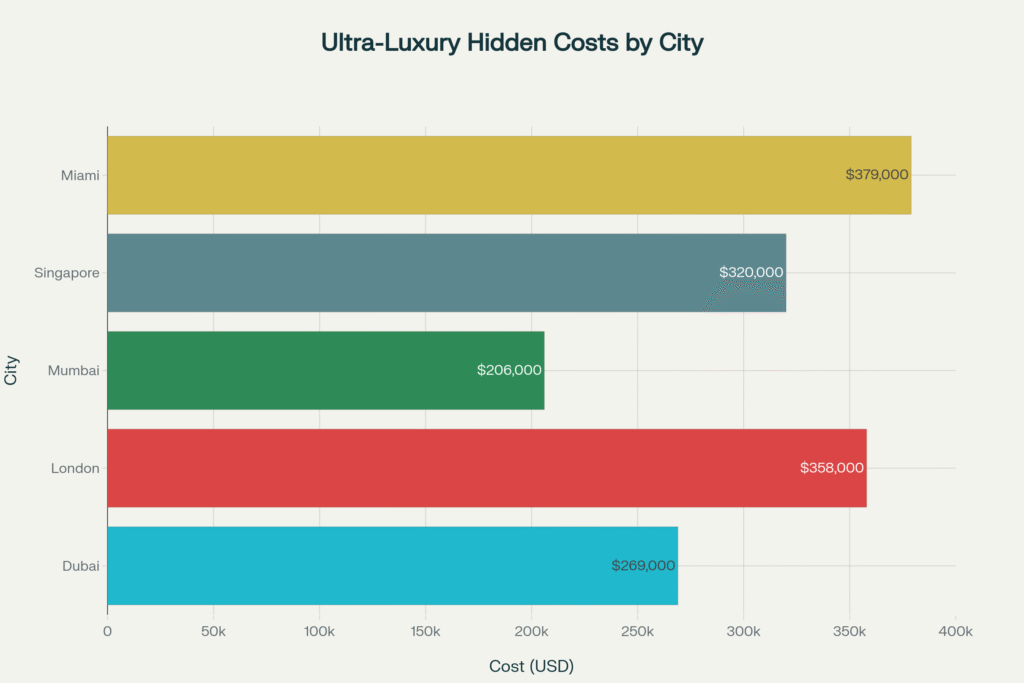
Annual Operational Expenditures Across Global Markets
The comparative analysis above reveals stark differences in annual carrying costs. Miami emerges as the most expensive market at $379,000 annually, driven primarily by its 2% property tax burden. London follows at $358,000, reflecting high maintenance standards and insurance premiums in a mature market. Singapore’s $320,000 annual cost stems from progressive property taxes reaching 32% for high-value properties.
Dubai’s $269,000 cost represents exceptional value considering its zero-tax environment—the $200,000 annual savings vs. Miami compounds to $4 million over 20 years. Mumbai offers the most cost-efficient ownership at $206,000 annually, though transaction costs (stamp duty, GST) create higher upfront barriers.
Purchase Transaction Costs (5-9% of Property Value)
Stamp Duty and Registration Fees: India’s stamp duty varies by state but typically ranges 5-7% in Mumbai and Delhi. For a ₹10 crore ($1.2 million) property, this represents ₹50-70 lakh ($60,000-$84,000). Registration fees add another 1-2% of sale price.
Goods and Services Tax (GST): Under-construction luxury properties attract 5% GST for non-affordable housing. On a ₹5 crore under-construction apartment, GST alone totals ₹25 lakh ($30,000). Ready-to-move properties bypass GST entirely.
Legal Due Diligence: High-value properties demand exhaustive legal scrutiny. Professional legal fees range ₹50,000-₹5 lakh ($600-$6,000) depending on complexity.
Lifestyle Infrastructure Costs
Household Staffing: Ultra-luxury living assumes professional support infrastructure. A typical billionaire household maintains estate managers, private chefs, housekeepers, butlers, security personnel, and personal assistants. Annual staffing costs vary:
- Mumbai: ₹60-80 lakh ($72,000-$96,000)
- London: £100,000-£125,000 ($125,000-$156,000)
- Dubai: $100,000-$150,000
- Miami: $120,000-$180,000
Strategic Comparative Analysis: Global Markets Decoded
Dubai vs. Miami vs. Mumbai: The Tax Arbitrage
Dubai’s Tax Advantage: Zero income tax, capital gains tax, and property tax translates to $200,000-$600,000 annual savings vs. high-tax jurisdictions like Miami or London. Over a 20-year holding period, this represents $4-12 million in retained wealth—potentially exceeding the original property value.
Mumbai’s Appreciation Premium: While transaction costs are high (11% including stamp duty and GST), Mumbai ranked 7th globally in luxury home price appreciation with 6.1% growth in Q4 2024. This capital appreciation compensates for higher upfront costs over mid to long-term horizons.
Miami’s Lifestyle Tax: Florida’s zero state income tax attracts wealthy individuals, but the 2% annual property tax creates $200,000 yearly obligation on a $10 million property. Combined with high insurance premiums (hurricane exposure) and elevated maintenance costs, Miami represents the most expensive ownership model globally.
Case Study One: Mumbai’s Ultra-Luxury Expansion – 360 West, Worli
Background: Oberoi Realty’s 360 West represents India’s ultra-luxury market maturation. This mixed-use development integrates Ritz-Carlton hotel and branded residences with apartments starting at ₹40 crore ($4.8 million). Since April 2023, sales have reached ₹1,300 crore ($156 million), attracting billionaire buyers including DMart’s Radhakishan Damani, Max Healthcare’s Abhay Soi, and Bollywood actors Abhishek Bachchan and Shahid Kapoor.
Hidden Cost Analysis:
Acquisition Phase:
- Stamp duty (6%): ₹2.4 crore ($288,000)
- GST (5%): ₹2 crore ($240,000)
- Registration fees (1%): ₹40 lakh ($48,000)
- Total transaction costs: ₹4.45 crore ($534,000)—11.1% of property value
Annual Operating Costs:
- Total annual: ₹78-86 lakh/year ($94,000-$103,000)
Five-Year Total Cost:
- Total commitment: ₹48.5 crore ($5.82M)—21.3% above sticker price
Strategic Insight: Developer Vikas Oberoi personally vets each buyer, ensuring brand prestige through selective ownership. This exclusivity premium commands sustained pricing power—properties have sold for over a decade without price cuts.
Case Study Two: Dubai’s Branded Residence Boom
Background: Dubai has emerged as the world’s branded residence capital with 140 projects delivering by 2031. In 2024, Dubai sold over 13,000 branded homes generating Dh60 billion ($16.3 billion), up 43% year-on-year. Buyers pay 40-60% premiums vs. standard luxury homes.
Tax Advantage Calculation:
- Dubai property owner (zero taxes) vs. Miami equivalent ($10M):
- Annual tax savings: $200,000 (property tax) + $400,000 (state income on rental) = $600,000/year
- 20-year savings: $12M—exceeding original property value
Case Study Three: Singapore’s Cooling Measures Impact
Background: Singapore implemented aggressive cooling measures culminating in 60% Additional Buyer’s Stamp Duty for foreign purchasers in April 2023.
Financial Impact Example ($5M property):
- ABSD: $3,000,000 (60%)
- Total upfront taxes: $3,196,600 (64% of property value)
- Total acquisition cost: $8,196,600
Comparison: London (15%) = $780,000; Dubai (4%) = $200,000; New York (4%) = $200,000
Tips for UHNI Portfolio Optimization
1. The Tax Arbitrage Strategy: Structure ownership through tax-efficient jurisdictions (UAE, Caribbean territories with double-taxation treaties). For a $10M property generating $700K annual rental income, this can save $200K-$400K yearly—$4-8M over 20 years.
2. The Currency Hedge Approach: NRIs earning USD/GBP should leverage favorable exchange rates when rupee depreciates. A 10% rupee decline effectively reduces property cost by 10% for foreign-currency earners.
3. The Lifestyle Manager ROI: Hiring a full-time estate manager ($80K-$150K annually) generates positive ROI through vendor negotiation savings (10-15%), preventive maintenance, and time reclamation for high-value activities.
4. Strategic Exit Timing: Properties held 24+ months in India qualify for long-term capital gains treatment (20% with indexation), substantially reducing tax burden vs. short-term flips.
5. Insurance Policy Collateralization: UHNW individuals can borrow against cash-value life insurance policies at 3-5% interest rates, using leveraged capital for property acquisitions while maintaining estate liquidity.
Risks and Challenges
Market Overheating Concerns
India’s luxury segment has witnessed explosive three-year gains (2022-2024), prompting concerns about sustainability. 62% of HNIs plan to invest in next 12-24 months (down from 71% in 2024), suggesting cautious optimism replacing exuberance.
Regulatory and Political Risk
Wealth taxes, retrospective taxation, and populist political shifts pose risks to UHNW asset holders. Countries facing fiscal pressures may implement mansion taxes, annual wealth levies, or higher capital gains rates.
Climate-Related Insurance Crisis
Weather-related instability is causing huge increases in luxury home insurance costs, with insurers excluding flood and groundwater damage in high-risk zones. Properties in flood zones or high-fire-risk areas face insurance availability crises, rendering them effectively uninsurable and unmarketable.
FAQ Section
What percentage of property value should I budget for hidden costs over five years?
Budget 29.5% of purchase price for transaction costs, maintenance, taxes, insurance, utilities, and staffing over the first five years. For a $10M property, this equals $2.95M in additional expenses beyond acquisition.
Which global city offers the best total cost of ownership for luxury property?
Dubai provides optimal tax efficiency with zero income, capital gains, and property taxes, translating to $200K-$600K annual savings vs. high-tax jurisdictions. However, Mumbai offers strongest capital appreciation, while Miami provides lifestyle appeal with moderate taxes.
How can NRIs optimize their Indian luxury property investments?
NRIs should: 1) Time purchases during rupee depreciation for currency advantage, 2) Focus on micro-markets with infrastructure growth (Worli, Bandra West, Golf Course Road), 3) Structure ownership through NRO/NRE accounts for repatriation flexibility, and 4) Claim tax treaty benefits to avoid double taxation on rental income.
What are the most overlooked hidden costs in ultra-luxury property ownership?
The most underestimated expenses are: household staffing ($80K-$150K annually), infrastructure replacement reserves ($25K-$40K over five years), property insurance increases (doubling in some markets), and specialized amenity maintenance (pools, wine cellars, home theaters totaling $5K-$10K annually).
Conclusion
The ultra-luxury real estate landscape stands at an inflection point, shaped by four transformative forces: explosive UHNI wealth creation, technological disruption, climate imperatives, and geopolitical realignment. India’s projected trajectory toward 19,908 UHNWIs by 2028—alongside a luxury market potentially exceeding $229 billion by 2034 (20.1% CAGR)—positions Indian real estate as one of this decade’s most compelling wealth-building opportunities.
Yet success demands more than capital—it requires strategic intelligence. The 29.5% hidden cost premium separates informed investors from those trapped by incomplete analysis. For UHNWIs, HNIs, and NRIs navigating this evolution, the hidden costs explored herein represent not obstacles but strategic levers—variables to optimize, negotiate, and structure for maximum after-tax, risk-adjusted returns.
The ultra-luxury property you acquire today is more than an address. It’s a multi-generational wealth anchor, a tax optimization vehicle, a lifestyle platform, and a legacy statement. Master its true economics, and you transform from property owner to wealth architect.
YouTube Learning Resources
Free resources to download
Ultra-Luxury Property Hidden Costs: Essential Investment Summary-01
Related Posts


Stay Informed With the Latest & Most Important News


Advertisement