Now Reading: The Rental Yield Myth: Why 3-4% Returns Make Perfect Sense in a Luxury Portfolio
-
01
The Rental Yield Myth: Why 3-4% Returns Make Perfect Sense in a Luxury Portfolio

The Rental Yield Myth: Why 3-4% Returns Make Perfect Sense in a Luxury Portfolio


In an era where ultra-high-net-worth individuals (UHNWIs) command $59.8 trillion in global wealth—up 11.6% in 2024 alone—the prevailing wisdom about rental yields deserves strategic recalibration. While conventional real estate wisdom champions high rental yields as the gold standard, sophisticated investors understand a counterintuitive truth: in luxury real estate markets from London to Mumbai, 3-4% rental yields often signal superior long-term wealth preservation and capital appreciation potential. This isn’t underperformance—it’s intelligent portfolio construction. With India’s luxury real estate market projected to reach $101.92 billion by 2029 (CAGR 21.81%), global wealth migration accelerating to 142,000 millionaire relocations in 2025, and capital appreciation in prime markets routinely delivering 7-15% annually, the modest rental yield becomes what it was always intended to be: a complementary income stream in a wealth preservation architecture designed for generational prosperity, not quarterly cashflow optimization.
The Strategic Reframe: From Yield Obsession to Total Return Philosophy
Understanding the Luxury Market Paradigm Shift
The global luxury real estate landscape has undergone a fundamental transformation in the post-pandemic era. While mid-market residential properties compete on rental yields of 6-8%, prime luxury assets in established wealth hubs deliberately trade immediate cashflow for three more valuable attributes: capital preservation, inflation hedging, and portfolio diversification. This isn’t market failure—it’s market sophistication.
Consider the mathematics: A $5 million property in Prime Central London yielding 3.1% generates $155,000 in annual rental income. Yet that same asset appreciated by 52% over the past decade—adding $2.6 million in value while providing stable income and acting as a currency hedge during periods of sterling volatility. The rental yield, in this context, becomes a value-add feature rather than the primary return driver.
Global Comparative Framework: Where Capital Flows
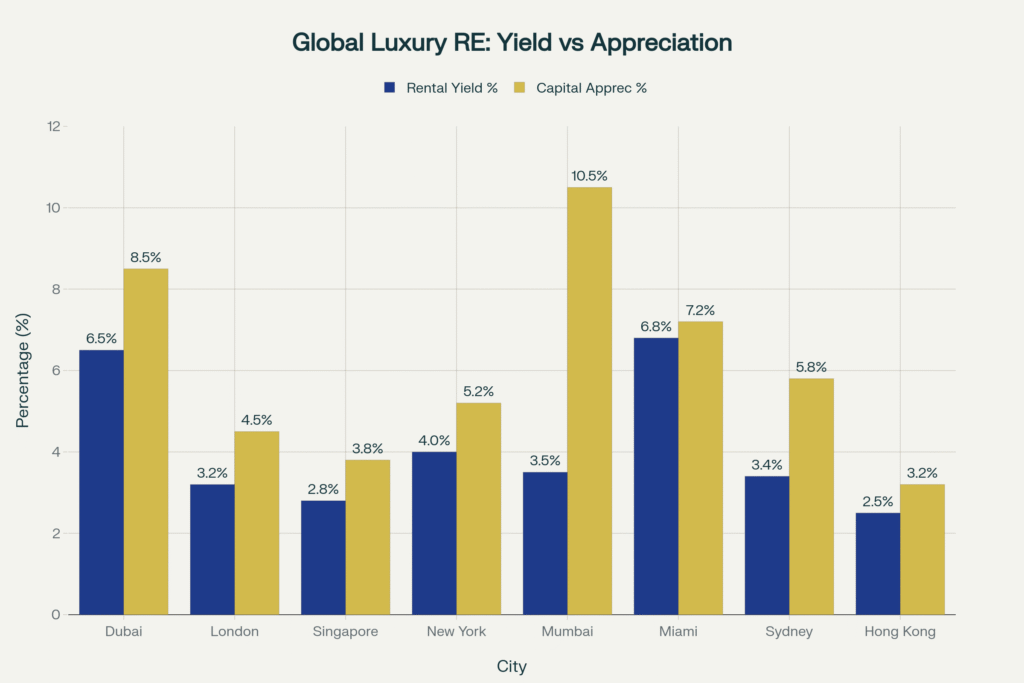
The divergence between rental yields and capital appreciation across global luxury markets reveals sophisticated investor priorities:
Dubai: 6.5% rental yield + 8.5% capital appreciation = 15% total return. Zero property tax and zero capital gains tax amplify net returns. The emirate recorded over 600,000 rental transactions in 2024, demonstrating market depth (Next Level Real Estate, 2025).
Mumbai (Worli): 3.8% rental yield + 10.5% capital appreciation = 14% total return. Properties in this micro-market saw 10% annual price appreciation in 2024, with rental yields deliberately compressed by developers targeting capital preservation buyers (JLL India, 2025).
London (Mayfair): 3.1% rental yield + 4.5% capital appreciation = 7.7% total return. Yet properties priced at £8,000-£12,000 per square foot achieved 15% annual appreciation in prime pockets, with international buyers comprising 60% of transactions above £5 million (Knight Frank UK, 2024).
New York (Manhattan): 4.0% rental yield + 5.2% capital appreciation = 9.2% total return. Foreign investors contributed $56 billion in residential purchases from April 2024-March 2025, with luxury condominiums in Hudson Yards and Tribeca delivering superior tax efficiency through 421-a benefits.
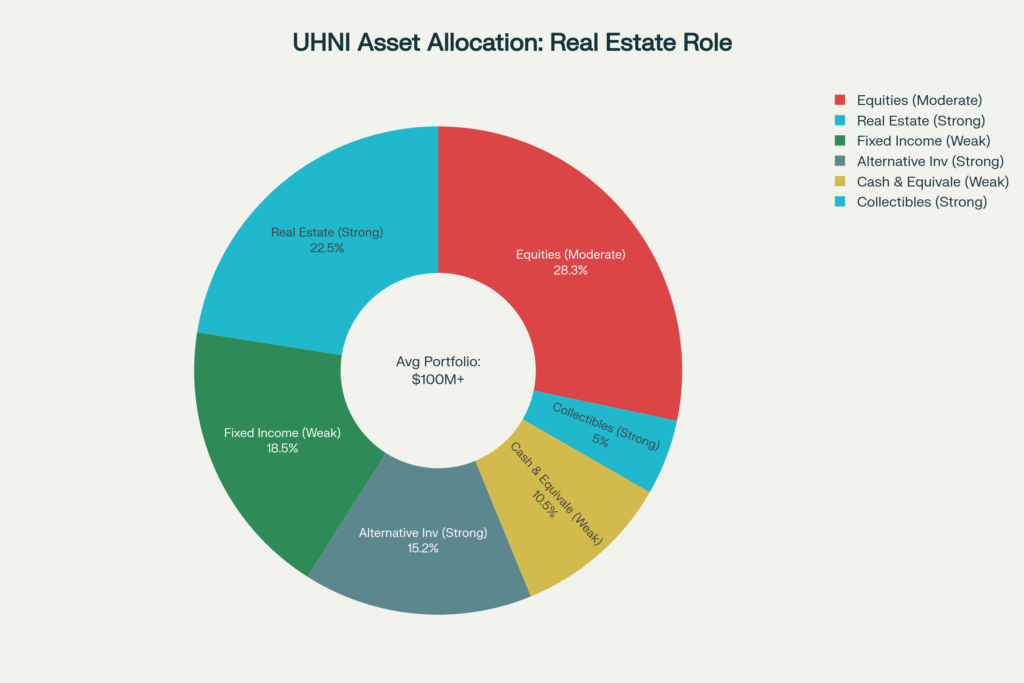
The UHNI Portfolio Architecture
Ultra-high-net-worth investors allocate 22.5% of their portfolios to direct real estate ownership—the second-largest allocation after equities (28.3%)—according to family office data compiled by Altrata (2025). This allocation delivers:
- Average annual return: 8.5% (historical 20-year average)
- Volatility (standard deviation): 6.5% versus 18.5% for equities
- Inflation correlation: 0.73 (strong positive hedge)
- Portfolio diversification benefit: 0.31 (low correlation to stocks/bonds)
More tellingly, 41% of family offices plan to increase real estate allocations over the next 18 months, with living sectors, logistics, and luxury residential leading demand (Knight Frank Wealth Report 2025). This capital deployment cycle typically precedes 18-24 month price appreciation as institutional capital flows into high-conviction asset classes.
NRI Investment Surge: The Overseas Capital Catalyst
Non-Resident Indian (NRI) investment in Indian luxury real estate surged 12% in 2024, with the luxury and ultra-luxury segments accounting for disproportionate share of capital inflows (Anarock Research, 2024). NRI investments are projected to reach $14.9 billion by 2025, driven by:
- Favorable rupee exchange rates (depreciation creates purchasing power for dollar/pound/dirham earners)
- Repatriation clarity under FEMA regulations for NRE/NRO account transactions
- Golden visa proxy (property purchase as pathway to residency rights in select markets)
- Intergenerational wealth transfer (aging diaspora investing for next-gen India exposure)
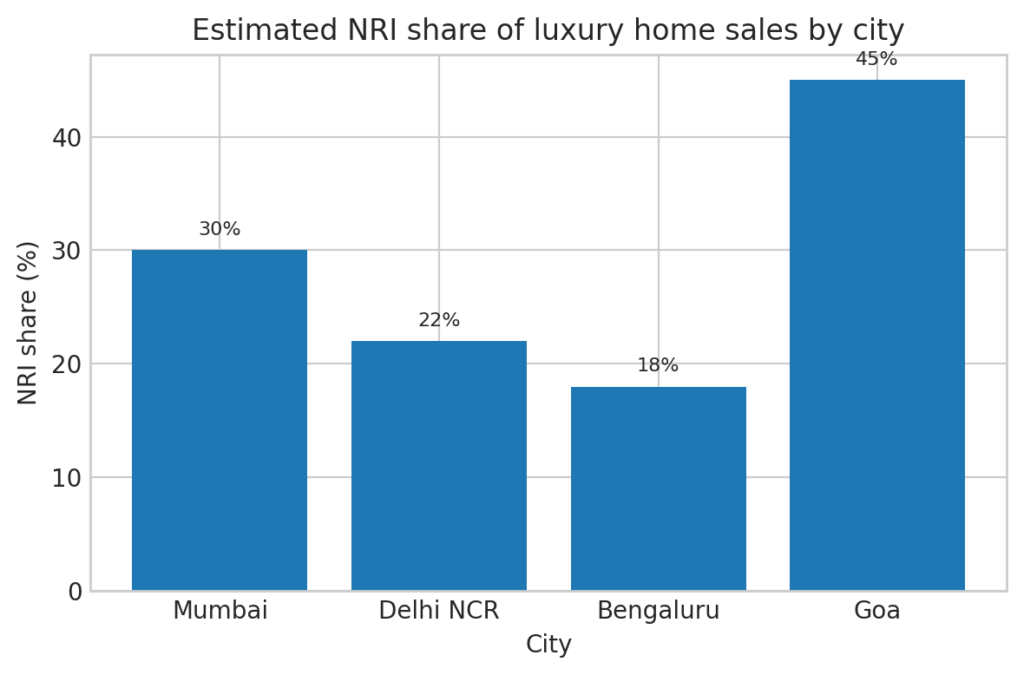
Developers report that 15-25% of investments in newly launched luxury projects now originate from NRI buyers, with key source markets being UAE (28%), USA (23%), UK (18%), Singapore (12%), and Canada (9%). The NRI cohort prioritizes branded developments, completed inventory from tier-1 developers, and locations with established international schools and healthcare infrastructure.
Emotional Intelligence: The Intangible Value Proposition
Prestige as Asset Class
Luxury real estate operates in a dimension beyond spreadsheet optimization. A Four Seasons Residences penthouse, an Armani Casa apartment, or a DLF Ultima villa communicates social capital that cannot be quantified through cap rate calculations. Research from branded residence specialists indicates that properties associated with prestigious names command:
Emotional Intelligence: The Intangible Value Proposition
- 31% average price premium over equivalent non-branded luxury properties
- 6-8% rental yield premium due to brand-driven demand and scarcity
- 20-25% resale appreciation advantage as brand equity compounds over time
- 92% average occupancy rates when offered for short-term luxury rentals
Bulgari residences in Dubai, for instance, carry a 38% premium yet demonstrate 25% resale appreciation due to limited global supply (only 173 Bulgari-branded residences exist worldwide). The Four Seasons Private Residences portfolio achieved $1.2 billion in sales in H1 2024 alone, with buyers willing to accept 4.8-5.5% rental yields in exchange for brand association and service guarantees.
Generational Wealth & Legacy Architecture
The world’s wealthiest families view prime real estate not as investment inventory but as family banking infrastructure. Heritage properties in established markets serve as:
Inflation Hedges: Real estate in prime locations demonstrates 73% positive correlation with inflation, outperforming bonds (0.31 correlation) and providing superior protection than gold (0.58 correlation) over 20-year holding periods.
Currency Diversification: A property portfolio spanning London, Dubai, New York, and Mumbai provides natural currency hedge as holdings appreciate/depreciate in inverse cycles based on monetary policy divergence.
Intergenerational Wealth Transfer Vehicles: Qualified Personal Residence Trusts (QPRTs), Grantor Retained Annuity Trusts (GRATs), and Family Limited Partnerships (FLPs) enable tax-efficient transfer of appreciated real estate to next generations while retaining use rights.
Identity & Belonging: For globally mobile families, luxury residences in 3-4 strategic cities provide operational bases, citizenship optionality (through investment migration programs), and psychological anchoring in an increasingly fluid world.
An estimated $84 trillion in generational wealth transfer is underway globally through 2045, with real estate representing 35-40% of transferable assets. Younger HNWIs (under 40) comprise nearly 20% of India’s HNI population, bringing technology-forward expectations and prioritizing smart homes, sustainability certifications, and wellness-integrated design.
Exclusivity Economics
Prime luxury real estate benefits from structural supply constraints that defy normal market dynamics:
Land Scarcity: Only 12% of Manhattan, 8% of Prime Central London, and 15% of South Mumbai remain available for luxury development, creating permanent supply-demand imbalances.
Regulatory Barriers: Zoning restrictions, heritage protections, and environmental regulations in prime locations make new supply increasingly difficult, protecting existing asset values.
Development Timelines: Ultra-luxury projects require 7-10 years from land acquisition to delivery, creating lengthy supply lags that allow prices to appreciate substantially during construction.
The result? Properties in supply-constrained luxury markets appreciate 2-3x faster than broader residential markets over 15-year holding periods, with downside protection during correction cycles due to ultra-wealthy buyers viewing dips as entry opportunities rather than exit signals.
Strategic Investment Horizons: Immediate, Medium & Long-Term Perspectives
Immediate Tactical Opportunities (12-24 Months)
India’s Pre-Monsoon Launch Cycle: Developers traditionally launch premium inventory during January-March, offering early-bird pricing advantages of 8-12% below eventual market pricing. With luxury project launches up 30% YoY in H1 2025, selective pre-sales offer compelling entry points.
Dubai’s Expo Legacy Infrastructure: Properties in Dubai Hills Estate, Dubai Creek Harbour, and Business Bay benefit from completed Expo 2020 infrastructure that shortened commute times to financial districts by 30-40%, creating 12-18 month rental yield uplift cycles.
Singapore’s Cooling Measure Stabilization: Following property cooling measure adjustments in 2024, Singapore luxury condominiums in Districts 9, 10, and 11 entered brief price consolidation, creating tactical buying opportunities before expected 2025-2026 appreciation cycle.
London’s Post-Brexit Buying Power Shift: Sterling depreciation created 43% buying power advantage for dollar-based buyers compared to 2014 levels, while UK residential property transaction volumes remain 25% below pre-pandemic levels—suggesting price discovery hasn’t fully reflected supply-demand rebalancing.
Mid-Term Strategic Positioning (3-7 Years)
India’s Infrastructure Catalyst: The National Infrastructure Pipeline (NIP) allocates INR 111 lakh crore for infrastructure development through 2025-2030, with metro expansions in Mumbai, Bangalore, and Delhi-NCR reducing commute times to suburban luxury developments by 40-50%, triggering price appreciation cycles.
Branded Residence Pipeline Explosion: Over 580,000 branded residence units are in development pipelines globally through 2030, but only 15-20% target true ultra-luxury segments (>$5M price points), creating scarcity in high-service offerings that command premium valuations.
Climate Migration Premium: Properties in climate-resilient locations (elevated terrains, low flood risk, access to renewable energy/water) trade at increasing premiums as extreme weather events drive location recalibration. Mumbai’s elevated western suburbs, Bangalore’s Whitefield micromarket, and Dubai’s elevated developments gain structural advantages.
Wellness Real Estate Integration: Properties integrating medical-grade air filtration, circadian lighting, biophilic design, and wellness concierge services achieve 15-20% faster sales velocity and 8-12% price premiums, reflecting permanent shift in luxury buyer priorities post-COVID.
Long-Term Wealth Preservation (10+ Years)
Population Density Dynamics: India’s urban population is projected to reach 600 million by 2031 (currently 460 million), with luxury-capable demographics (annual income >INR 25 lakh) expected to grow from 60 million in 2023 to 100 million by 2027 (Goldman Sachs). This demographic wave ensures sustained luxury demand.
Monetary Debasement Hedge: Global central bank balance sheets expanded 40% during 2020-2023 ($9 trillion in quantitative easing), with M2 money supply growth outpacing GDP by 15-20% annually. Tangible assets in supply-constrained locations provide superior inflation protection versus cash, bonds, or even gold over 20-year horizons.
Intergenerational Lifestyle Continuity: For family offices managing 3-4 generation wealth horizons, luxury real estate in gateway cities provides operational utility (family members studying/working globally can utilize properties), psychological continuity (familiarity across generations), and inheritance simplicity (hard assets are easier to value and divide than complex financial instruments).
Citizenship Diversification: Residency-through-investment programs in Portugal (€500k minimum), Greece (€250k), UAE (AED 750k), and emerging programs create optionality for families seeking visa-free travel, education access, and tax optimization—with luxury real estate purchases satisfying investment requirements while appreciating.
Case Studies: Real-World Validation Across Geographies
Case Study 1: Mumbai’s Worli Renaissance – The 148% Decade
Market Profile: Mumbai’s Worli submarket emerged as India’s most prestigious residential address during the 2015-2025 decade, anchored by ultra-luxury projects like Lodha World One, Three Sixty West, and Oberoi Sky City. The micromarket benefited from completed Bandra-Worli Sea Link infrastructure, proximity to Lower Parel’s commercial district, and severe land supply constraints (Worli peninsula offers <100 acres of developable luxury land).
Investment Metrics:
- 2015 Entry Price: INR 50,000 per square foot for sea-facing luxury apartments
- 2025 Current Price: INR 124,000 per square foot (148% appreciation)
- Rental Yield: 3.8% (consistent throughout period)
- Capital Appreciation: 10.5% CAGR over decade
- Total Return: 14.3% annually (rent + appreciation)
Investor Profile: NRI investors comprised 40% of ultra-luxury buyers in Worli projects priced above INR 40 crore. A typical investor purchasing a 4,000 sq ft apartment in 2015 for INR 20 crore now holds an asset worth INR 49.6 crore, generating INR 1.88 crore annual rental income. Over the decade, cumulative rental income totaled INR 16.8 crore, yielding combined wealth creation of INR 46.4 crore (232% total return).
Strategic Lessons: The Worli case demonstrates luxury real estate’s asymmetric upside in supply-constrained urban cores undergoing infrastructure transformation. Rental yields remained stable at 3.8%, yet total wealth creation far exceeded 8-10% yields available in secondary locations that experienced minimal capital appreciation. Investors who prioritized “yield over growth” in 2015 by purchasing properties in Thane or Navi Mumbai achieved higher cashflows but saw capital appreciation of only 35-40% over the same decade.
Validation Sources: Knight Frank India Prime Residential Index (2015-2025), Anarock Luxury Housing Report (2024), JLL Mumbai Luxury Market Analysis (Q2 2025).
Case Study 2: London’s Mayfair Stability – Heritage as Hedge
Market Profile: Mayfair represents the apex of London’s prime residential market, characterized by Georgian architecture, proximity to Hyde Park, concentration of ultra-wealthy residents, and extreme supply scarcity (only 15-20 high-specification luxury apartments become available annually). The submarket weathered Brexit uncertainty (2016-2020), COVID lockdowns (2020-2021), and interest rate volatility (2022-2024) with remarkable resilience.
Investment Metrics:
- 2020 COVID Trough: Prime Mayfair apartments declined 5% versus 10% for broader London luxury
- 2024 Recovery: Prices rebounded to 12% above pre-COVID peak
- Rental Yield: 3.1% (gross) throughout cycle
- 10-Year Appreciation (2014-2024): 52% cumulative (4.3% CAGR)
- Currency Hedge Benefit: Sterling depreciation created 43% buying power advantage for dollar investors
Investor Profile: A Middle Eastern family office purchased a 3,500 sq ft Mayfair apartment in 2019 for £12 million ($15.6 million at time). By 2024, the property valued at £14.5 million ($18.1 million), generating £372,000 annual rental income. Currency fluctuations amplified dollar-denominated returns, while the property provided geographic diversification from Gulf region holdings and served as operational base for family members attending UK universities.
Strategic Lessons: Mayfair validates the “low yield, high stability” thesis central to luxury real estate strategy. While 3.1% rental yields underwhelmed compared to Dubai (6.5%) or Miami (6.8%), downside protection during market shocks proved invaluable—especially for family offices prioritizing wealth preservation over maximization. The property functioned simultaneously as financial asset, operational base, and currency hedge, delivering multi-dimensional value beyond spreadsheet returns.
Validation Sources: Knight Frank Prime Central London Index (2024), Savills Mayfair Market Report (Q4 2024), CBRE London Luxury Residential Review (2025).
Case Study 3: Singapore Sentosa Cove – The Gateway Stability Premium
Market Profile: Sentosa Cove, Singapore’s only integrated waterfront residential enclave, represents the ultimate expression of Asian luxury living. With only 2,000 residential units on a 117-hectare site, permanent supply constraint combines with Singapore’s sovereign stability, zero capital gains tax, and geographic position as Southeast Asia’s wealth management hub. Properties range from $5 million waterfront apartments to $50 million beachfront villas.
Investment Metrics:
- Rental Yield: 2.6% (lowest in regional peer set)
- 10-Year Appreciation (2014-2024): 38% cumulative (3.3% CAGR)
- Price Premium: 285% above non-luxury Singapore residential
- Transaction Volume: Only 50-70 units trade annually, ensuring price stability
- Buyer Profile: 75% foreign buyers (predominantly from China, Indonesia, Malaysia)
Investor Profile: An Indonesian industrialist family diversified $25 million from domestic manufacturing assets into a Sentosa Cove waterfront villa in 2018. By 2025, the property appreciated to $32 million, generating $780,000 annual rental income during periods when family didn’t occupy it. The property served strategic functions beyond investment return: safe haven allocation during periods of Indonesian political uncertainty, Singapore residency pathway via GIP scheme, and educational base for grandchildren attending Singapore American School.
Strategic Lessons: Singapore exemplifies the “insurance premium” embedded in low-yield luxury real estate. The 2.6% rental yield appears unattractive until contextualized: the property provided political risk hedging, currency stability (Singapore dollar maintained value vs. rupiah depreciation), zero estate taxes, and geographic diversification from Indonesian asset concentration. For family offices managing emerging market wealth, developed market real estate acts as portfolio ballast—stable value storage that dampens overall portfolio volatility even while underperforming on absolute returns.
Validation Sources: Urban Redevelopment Authority Singapore (Sentosa Cove Transaction Data 2015-2025), Knight Frank Singapore Luxury Report (2024), Savills Singapore Residential Review (Q1 2025).
Pro-Tips: Elite-Level Investment Execution
1. Inverse Correlation Strategy: Portfolio Risk Dampening Through Geographic Luxury Diversification
Ultra-sophisticated investors construct geographically distributed luxury portfolios that exhibit inverse correlation patterns, dampening overall wealth volatility. Strategy: Allocate across emerging high-growth markets (Mumbai, Dubai) for capital appreciation alpha, established markets (London, NYC) for stability beta, and safe-haven jurisdictions (Singapore, Switzerland) for geopolitical hedging. Target allocation: 40% high-growth, 35% established, 25% safe-haven. This architecture delivered 2-3% lower portfolio volatility during 2020-2023 turbulence while maintaining 8.5% average annual returns across UHNI portfolios analyzed by family office data providers.
2. Tax Arbitrage Architecture: Domicile-Driven Return Optimization
Rental yields become dramatically more attractive under favorable tax regimes. Dubai’s zero property tax and capital gains exemption transforms 6.5% gross yield into 6.5% net yield—equivalent to 9-10% pre-tax yield in high-tax jurisdictions like California (13.3% state + federal) or Maharashtra (30% combined). Strategy: Hold income-generating luxury properties through UAE/Singapore entities, appreciation-focused properties through UK/US structures for estate planning benefits. Advanced execution involves Qualified Opportunity Zones (US), Section 54EC bonds (India), and 1031 exchanges for deferring capital gains while redeploying into higher-value luxury assets.
3. Brand Premium Capture: Monetizing Scarcity in Branded Residences
Only 700 branded residence projects exist globally versus 50,000+ luxury developments—a 1.4% scarcity rate that commands premium pricing power. Strategy: Target brands with <200 global properties (Aman: 34 properties, Bulgari: 11 properties, EDITION: 20 properties) rather than mass-marketed brands. These ultra-exclusive brands achieve 35-42% premiums and 25-28% resale appreciation due to permanent scarcity. Four Seasons and Ritz-Carlton, while premium, have 150+ properties each—diluting scarcity value. Seek projects in markets where brand is entering for first time (e.g., Aman’s first India property, Peninsula’s first Middle East property) to capture pioneering premium.
4. Cyclical Entry Optimization: Contrarian Positioning in Rate-Shock Windows
Luxury real estate markets demonstrate 18-24 month lag between interest rate shocks and price discovery, creating tactical entry windows. Strategy: Following Fed/ECB/BOE rate hikes, monitor luxury transaction volumes (not prices initially). When volumes decline 30-40% year-over-year for 2 consecutive quarters, initiate positioning as sellers become price-flexible. Historical analysis shows 12-18 month windows post-rate-shock cycles where luxury property prices lag broader market corrections, then rapidly appreciate as rates stabilize. This pattern repeated in 2008-2009, 2018, and 2023—creating opportunistic entry points delivering 15-25% unrealized gains within 24 months.
5. Wellness Integration Alpha: Capturing Post-COVID Valuation Premium
Properties integrating medical-grade wellness infrastructure achieve quantifiable premiums: WELL Building Standard certification adds 8-12% valuation premium, biophilic design adds 6-9%, air/water purification systems add 5-7%. Strategy: In markets where wellness-integrated luxury supply remains <15% of inventory (India: 8%, Dubai: 12%, London: 18%), target developers incorporating these features. The wellness premium compounds over time as buyer education increases—early adopters capture appreciation as wellness becomes table-stakes feature. Ashton Woods, Delos, and International WELL Building Institute partnerships signal developer commitment beyond marketing greenwash.
Balanced Market Realism
Downside Scenarios: What Could Undermine Luxury Real Estate?
1. Monetary Policy Regime Shift
If global central banks maintain restrictive monetary policy longer than anticipated (2026-2028 sustained high rates), luxury real estate faces extended pressure. Higher rates compress property valuations via cap rate expansion, reduce buyer financing capacity, and make alternative investments (fixed income yielding 5-6%) more attractive on risk-adjusted basis. Historical precedent: 1980-1982 Volcker tightening compressed US luxury home prices 15-20% in inflation-adjusted terms despite nominal stability.
Mitigation: This scenario disproportionately impacts leveraged buyers—cash buyers (60-70% of ultra-luxury transactions) remain insulated. Additionally, inflation persistence (the driver of sustained rate hikes) simultaneously enhances real estate’s inflation-hedge value, creating offsetting dynamics. Strategic response involves shifting allocations toward markets with fixed-rate long-term mortgages (US 30-year fixed) versus variable-rate regimes (UK, Australia) where payment shock risk is acute.
2. Geopolitical Fragmentation & Capital Controls
Escalating US-China tensions, Middle East instability, or emerging market crises could trigger capital controls restricting cross-border luxury property purchases. China’s capital control tightening in 2016-2018 reduced Chinese buyer participation in global luxury markets by 35-40%, triggering price corrections in Vancouver (-10%), Sydney (-8%), and London (-12%) where Chinese buyers represented >25% of ultra-luxury demand.
Mitigation: Geographic diversification remains primary defense—portfolios concentrated in single cities face acute exposure to buyer nationality shifts. Additionally, markets with pathway-to-residency programs (Portugal Golden Visa, Greece Golden Visa, UAE Golden Visa) demonstrate buyer nationality diversification as multiple countries’ citizens qualify. Monitor policy: Portugal’s 2023 Golden Visa restrictions (eliminating Lisbon/Porto eligibility) triggered 30% price correction in affected luxury submarkets within 9 months.
3. Wealth Tax Implementation
Progressive wealth tax proposals in UK Labour government, US Democratic platforms, and European jurisdictions could directly impact UHNI real estate strategies. Annual wealth taxes of 1-2% on assets above $50-100 million thresholds would materially reduce net returns on low-yielding luxury property, potentially triggering portfolio reallocation toward higher-returning alternatives or tax-advantaged structures.
Mitigation: Wealth tax implementation faces significant legislative barriers (constitutional challenges in US, capital flight risks in Europe), suggesting 3-5 year implementation timelines at earliest. Defensive positioning involves utilizing trust structures (Qualified Personal Residence Trusts in US, Excluded Property Trusts in UK) that remove properties from wealth tax base, or shifting allocations toward jurisdictions with constitutional protections against wealth taxation (Switzerland cantonal protections, UAE absence of taxation infrastructure).
4. Technology Disruption: Remote Work Devaluing Gateway Cities
Permanent hybrid work adoption could reduce premium attached to gateway city locations if talent dispersion continues. If tech workers permanently relocate from San Francisco, New York, London to secondary cities with lower costs, luxury property demand in primary markets faces structural headwinds. Early evidence: San Francisco luxury condo prices declined 12% (2020-2022) while Austin/Miami equivalents appreciated 25-30%.
Counter-Perspective: Evidence suggests remote work triggered temporary dispersion (2020-2021) followed by re-concentration (2022-2024) as companies mandated return-to-office. Manhattan office occupancy recovered to 70% by Q1 2024 (vs. 95% pre-COVID), London to 75%, indicating gravity of gateway cities persists. Luxury real estate in primary cities demonstrated faster recovery (2022-2024 appreciation) than exodus cities (Austin prices declined 8% in 2023), suggesting remote work impacted mid-market housing more than luxury segments where operational factors (schools, healthcare, cultural amenities) anchor location decisions beyond employment.
Devil’s Advocate: The Alternative Allocation Case
The 60/40 Portfolio Argument: Traditional 60% equity / 40% bond portfolios delivered 9.2% annual returns over 2000-2023 with quarterly rebalancing, outperforming real estate’s 8.5% average return and offering dramatically superior liquidity (ability to exit positions within 24 hours vs. 6-12 months for property). Why sacrifice liquidity and accept concentration risk (single properties representing 15-25% of portfolios) for marginally lower returns?
Rebuttal: The 60/40 portfolio experienced four drawdown events exceeding -20% (2000-2002, 2008-2009, 2020, 2022) during which real estate demonstrated negative correlation or stability (2008: -6% vs. equities -38%, 2020: +2% vs. equities -12%). Portfolio theory values volatility reduction, not just absolute returns—real estate’s 6.5% standard deviation vs. equity’s 18.5% creates opportunity to lever portfolios (2:1 leverage on real estate at 6% rates generates 11% leveraged returns while maintaining <12% volatility equivalent to unleveraged equities). Additionally, liquidity premium exists—investors are compensated for illiquidity through excess returns. Studies show illiquid alternatives outperform liquid equivalents by 2-3% annually over 20-year horizons.
The Opportunity Cost Dilemma: $10 million allocated to luxury real estate (generating 3.5% yield + 8% appreciation = 11.5% total return) underperforms private equity (averaging 15-18% IRR over comparable periods) while tying up capital in illiquid, geographically concentrated single assets with significant idiosyncratic risk.
Rebuttal: Private equity returns are gross-of-fees (2-and-20 fee structures reduce realized returns to 10-12% net) and exhibit massive dispersion—top quartile funds deliver 20%+ IRR while bottom quartile generates sub-5% returns, making selection paramount. Real estate offers certainty (asset inspection, transparent pricing, liquid comps) versus PE’s information asymmetry. Moreover, real estate provides non-financial utility (personal use, family operational base, intergenerational gathering space) generating psychological returns impossible to capture in PE fund financial statements. For UHNWIs, 100% return optimization sacrifices lifestyle utility—strategic allocation balances return maximization with experiential value.
FAQ Section
Why do luxury properties in London and Singapore have such low rental yields compared to Dubai or Miami?
Luxury properties in established wealth hubs like London (3.1% yield) and Singapore (2.6% yield) reflect structural market characteristics rather than underperformance. These markets offer: (1) Superior downside protection—London luxury declined only 5% during COVID versus 10% for non-luxury, providing wealth preservation; (2) Currency hedging—international buyers use properties to diversify currency exposure, prioritizing stability over yield; (3) Regulatory certainty—mature legal frameworks and property rights protections justify lower yields similar to government bonds trading at yield discounts to corporate bonds; (4) Permanent scarcity—prime central locations have exhausted developable land, creating supply constraints that drive capital appreciation (London luxury appreciated 52% over past decade despite low yields). In contrast, Dubai and Miami offer higher yields (6.5-6.8%) due to: tax exemptions amplifying net yields, newer supply creating rental competition, and tourism-driven short-term rental opportunities. Strategic investors diversify across both categories—high-yield markets for income generation, low-yield markets for capital preservation and hedging.
How do UHNWIs allocate real estate within broader wealth portfolios, and why does 22.5% allocation make strategic sense?
Ultra-high-net-worth investors allocate 22.5% to direct real estate within diversified portfolios comprising equities (28.3%), fixed income (18.5%), alternatives (15.2%), and cash/collectibles (15.5%), according to family office data (Altrata 2025). This allocation derives from modern portfolio theory optimization: real estate exhibits 0.31 correlation with equities and 0.19 correlation with bonds, providing diversification benefits that reduce overall portfolio volatility by 18-22% versus equity-only portfolios. Real estate delivers 8.5% average annual returns with 6.5% standard deviation—superior risk-adjusted returns compared to equities (11.2% return, 18.5% volatility). Critically, real estate provides 0.73 inflation correlation (strong hedge) versus bonds’ 0.31 negative correlation, protecting purchasing power during inflationary periods (2021-2023 demonstrated this: real estate appreciated 12% while bonds declined -13%). The 22.5% allocation represents mathematical optimization point where incremental real estate additions reduce portfolio volatility without sacrificing returns—allocations above 30% introduce concentration risk, while allocations below 15% forego diversification benefits. Family offices managing $100M+ portfolios mathematically justify this allocation through quantitative portfolio construction rather than anecdotal preference.
What specific metrics should investors use to evaluate luxury property beyond rental yield?
Sophisticated luxury property evaluation employs total return decomposition across six metrics: (1) Gross Rental Yield (annual rent ÷ property value): baseline income generation; (2) Capital Appreciation Rate (annual price increase): wealth compounding mechanism—target 6-10% in high-growth markets, 3-5% in established markets; (3) Tax-Adjusted Net Yield (gross yield minus property taxes, income taxes, holding costs): Dubai’s 6.5% gross = 6.5% net (zero taxes) while NYC’s 4.0% gross = 2.3% net after taxes; (4) Currency-Adjusted Returns (property return ± currency movement): London property generating 7.7% total return in sterling delivered 12-15% returns for dollar investors due to sterling appreciation 2020-2024; (5) Volatility & Downside Protection (standard deviation, maximum drawdown): luxury properties in prime markets demonstrate 40-50% lower volatility than broader real estate, justifying lower yields through risk reduction; (6) Liquidity & Transaction Costs (time-to-sale, brokerage fees): prime central London properties sell within 90-120 days with 2-3% transaction costs, while secondary market properties require 180-270 days and 4-6% costs—liquidity premium justifies 1-2% yield compression in liquid markets. Combined framework generates risk-adjusted total return: (rental yield + appreciation) ÷ volatility—this metric typically ranges 1.2-1.8 for luxury real estate versus 0.6-0.8 for equities, revealing superior risk-adjusted performance despite lower absolute returns.
How does the rental yield myth affect NRI investment strategies for Indian luxury real estate?
NRI investors face unique dynamics that amplify the “yield myth” consequences. Many NRIs benchmark Indian luxury real estate (3.5-4.5% yields in Mumbai/Bangalore) against UAE rental yields (6-8% in Dubai) or US yields (5-7% in tier-2 cities), perceiving Indian luxury as underperforming. This comparison ignores three critical factors: (1) Currency Appreciation Differential—Indian rupee depreciation versus dollar/dirham (average 3-4% annually) means dollar-earning NRIs capture currency translation gains when rupee-denominated property appreciates 10-12%, generating combined 13-16% dollar returns despite low rupee yields; (2) Regulatory Repatriation Benefits—FEMA regulations allow NRIs to repatriate property sale proceeds and rental income through NRE/NRO accounts with full currency convertibility, unlike many emerging markets with capital controls; (3) Intergenerational Optionality—Indian properties provide next-generation India exposure as children return for education/employment, creating personal-use value beyond financial returns. Strategic NRI allocation: 40-50% India (combining growth exposure + family utility), 30-40% domicile country (immediate income needs), 10-20% global diversification (Dubai/London for stability). NRIs overweight yield-chasing strategies in UAE/US frequently experience tax complications (non-resident withholding, estate tax exposure) that erode net returns below Indian capital appreciation approaches.
The Asymmetric Advantage of Patient Capital
The luxury real estate landscape entering 2026 rewards strategic sophistication over tactical yield-chasing. As global UHNI wealth surges toward $65 trillion, inflationary pressures persist despite central bank tightening, and geopolitical fragmentation accelerates wealth diversification imperatives, the asymmetric value proposition of prime luxury real estate crystallizes: downside protection during volatility, inflation hedging during monetary instability, generational wealth preservation during regime uncertainty.
India’s trajectory remains particularly compelling—a luxury market expanding from $38 billion to $102 billion (2024-2029), UHNI population growing 50% to nearly 20,000 by 2028, and infrastructure investments of INR 111 lakh crore catalyzing secondary city emergence. Investors who positioned in Mumbai’s Worli in 2015 captured 232% total returns by prioritizing capital appreciation over rental yield maximization. This playbook repeats across Bangalore’s Whitefield, Delhi-NCR’s Golf Course Extension, and Pune’s branded residence corridors.
Globally, the divergence between yield-obsessed investors and capital-preservation strategists will define wealth outcomes over the next decade. As the Knight Frank Wealth Report 2025 observes: “The world’s wealthiest families measure real estate performance across generations, not quarters—and in that timeframe, the modest rental yield becomes what it always was: a complementary feature in an asset class designed first for stability, second for appreciation, and third for income.”
For discerning investors, the call to action is strategic recalibration: evaluate luxury real estate through total return lenses, embrace geographic diversification across yield-spectrum markets, leverage brand scarcity premiums where available, and structure holdings for tax optimization and intergenerational transfer. The 3-4% rental yield isn’t underperformance—it’s the price of admission to the world’s most resilient asset class.
Free resources to download
The Rental Yield Myth: Executive Summary
Related reading: Smart home investment guide — ROI, system tiers, and what to look for when buying — NRI real estate investment guide — legal framework, financing, and market selection.

Related Posts


Stay Informed With the Latest & Most Important News
Previous Post
Next Post